07718 933598

07718 933598

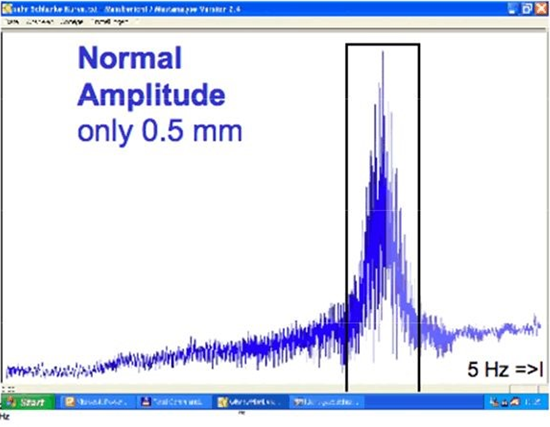
A graph of the amplitude of the column oscillations plotted against time (on the horizontal axis) for the duration of the test shows a characteristic pattern.
The blue graph below shows a test cycle for a healthy column. At the left of the graph the column is at rest so the oscillations (indicated by the vertical axis) are relatively small. As the rotation device is started the amplitude of these oscillations gradually increases to a maximum (shown in the boxed area of the graph). When the rotation device decelerates and eventually stops the amplitude dies back to its original ambient value.
The amplitude and the uniform shape of the graph indicate that the column is structurally sound.
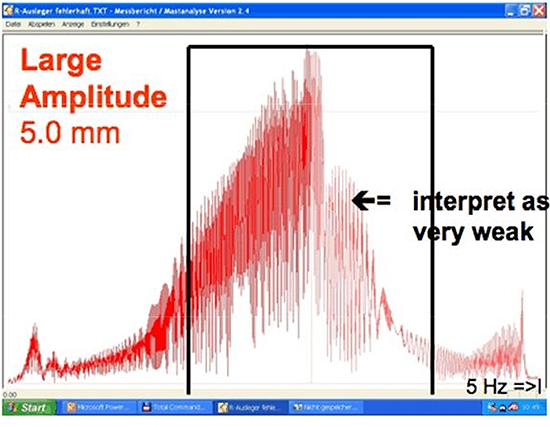
The following graph shows a column that is weak causing a large amplitude and an irregular profile during the recovery period.
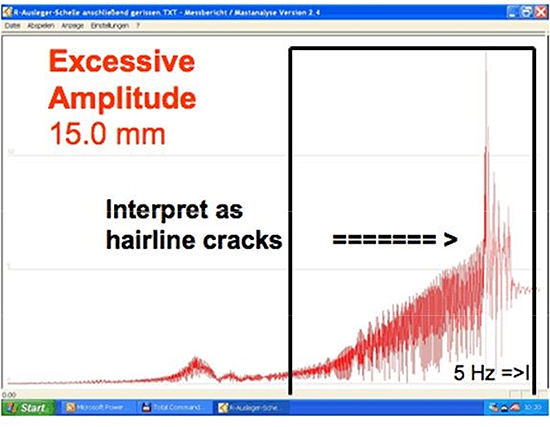
The following graph shows a column that has a hairline crack which causes an excessive amplitude to be observed.